Making Custom Styles
You can make custom styles which can be applied to your output.
For example, you could make a retro80s style and use that in your design definitions like:
style_name='retro80s',
To make a custom style, copy an existing style YAML file, and change the colours. You might also want to change the background image / colour for the table space-holder.
After you put the style YAML file where sofastats_lib expects to find it, the style will be available to use. For example:
/path/to/Documents/sofastats/custom_styles/retro80s.yaml
Configuring YAML files
Each style is defined by a YAML file. E.g. retro80s.yaml would define the 'retro80s' style. YAML is a simple layout for settings.
Style YAML files have the following structure:
- Variables e.g. colours given names to make the settings below easier to understand and for use for multiple settings
- Chart style settings
- Report Table style settings
- Statistics Table style settings
Naming Colours
A big benefit of giving colours names is that it is more readable and easier to sanity check the settings. They can also be defined once and used multiple times throughout the settings. For example:
# VARIABLES - the variable name is arbitrary as long as it's unique

color_variable_1: &sofastats_blue '#3766a1'
color_variable_2: &sofastats_blue_faded '#5a84b8'

...

# Report Tables
...

top_left_table_space_holder_background_color: *sofastats_blue

item_1_main_color: *sofastats_blue
item_1_hover_color: *sofastats_blue_faded
Setting a variable for tool-tips and the optional background image has the advantage of reducing the clutter and complexity of the actual settings.
Some gotchas:
- Don't forget the leading hash:
'#ff0000'will work but'ff0000'won't - Don't forget the asterisk when using a variable later, and don't quote references
- so
*sofastats_bluewill work butsofastats_blueor'sofastats_blue'will not
Hover Colours
When a bar, for example, is hovered over by the mouse, the bar moves slightly and its colour changes. If you defined a hover_color then this is the colour the bar will temporarily display. If you don't, a default highlight function will automatically decide on a suitable hover color.
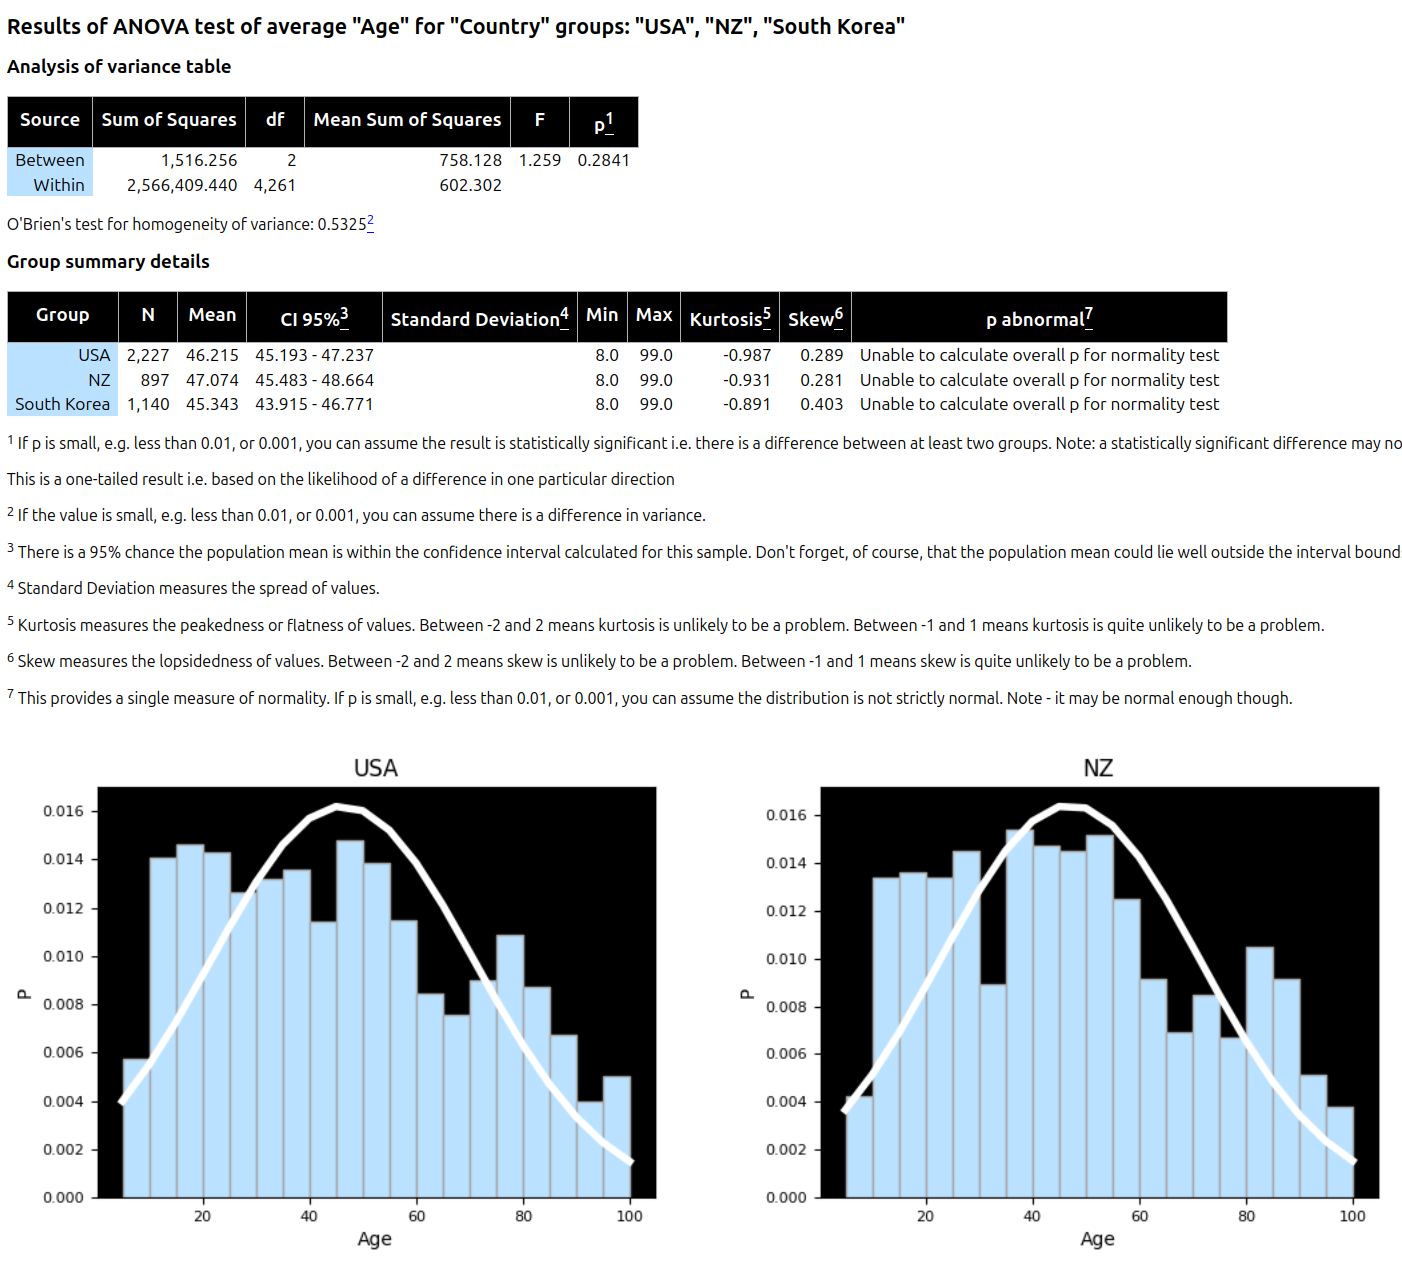
Example Chart Settings
Style 1
# Charts

chart_background_color: *white
chart_title_font_color: *black_brown

plot_background_color: *light_gray_blue
plot_font_color: *black_brown

axis_font_color: *black_brown

major_grid_line_color: *mid_gray_brown
grid_line_width: '1'
border_width: '1'
border_color: 'white'

tool_tip_border_color: *charcoal_brown
normal_curve_color: *black_brown

item_1_main_color: *burnt_orange
item_1_hover_color: *orange
item_2_main_color: *yorange
item_2_hover_color: *pale_yorange
item_3_main_color: *blue_turquoise
item_3_hover_color: *turquoise
item_4_main_color: *dark_green
item_4_hover_color: *green
item_5_main_color: *off_scarlet
item_5_hover_color: *pale_scarlet
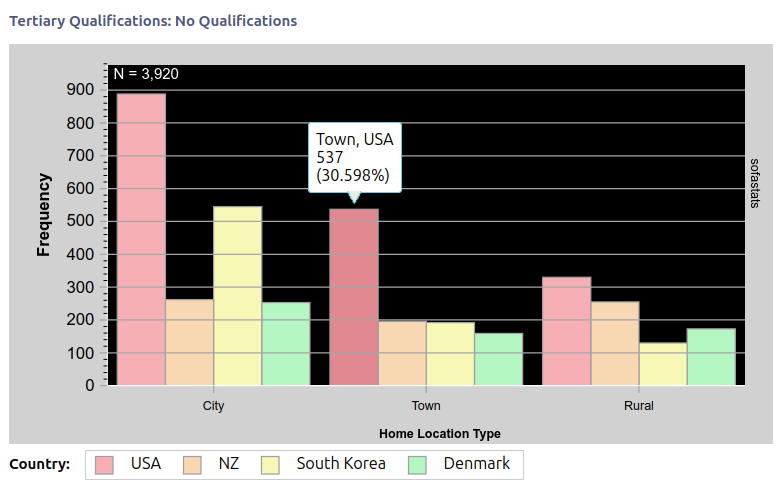
Style 2
# Charts

chart_background_color: '#d1d1d1'
chart_title_font_color: '#4c547c'

plot_background_color: 'black'
plot_font_color: 'white'

axis_font_color: '#000000'

major_grid_line_color: '#a6a6a6'
grid_line_width: '1'
border_width: '1'
border_color: '#a0a0a0'

tool_tip_border_color: '#6ecadf'
normal_curve_color: '#4c547c'

item_1_main_color: '#f7afb6'
item_1_hover_color: '#e18891'
item_2_main_color: '#f7d8b3'
item_2_hover_color: '#dfb889'
item_3_main_color: '#f7f7b6'
item_3_hover_color: '#e3e38e'
item_4_main_color: '#b4f7c3'
item_4_hover_color: '#90e0a2'
Creating Embeddable / Portable Images
You will need to convert your background and tool-tip images into base-64 encoded string. You can then give them a name and refer to them elsewhere in the same YAML file.
This is entirely optional - you only need to create the base-64 encoded strings if you want a background image or want different tool-tips from those supplied in the different built-in styles.
top_left_table_space_holder_background_image: "data:image/gif;base64,R0lGODl...A7" ## image converted to base64 - see below
import base64

image_file_path = '/path/to/image.png'
binary_fc = open(image_file_path, 'rb').read()  ## fc a.k.a. file_content
img_base64 = base64.b64encode(binary_fc).decode('utf-8')
print(f'"data:image/gif;base64,{img_base64}"')
Chart Tool-Tips
Tool-tips show over items when the mouse if moved over them.
The colour of the main border of the tool-tip is defined by tool_tip_border_color.
Small pointers show alongside the bordered box depending on which direction the tool-tip connects from.
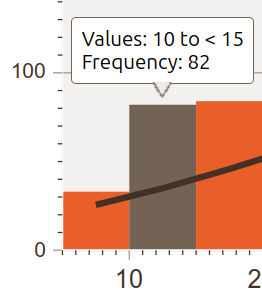
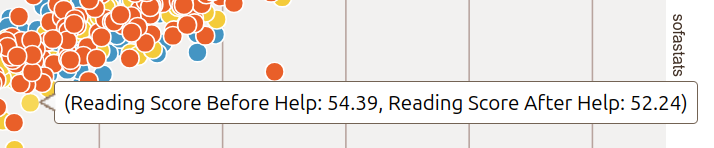
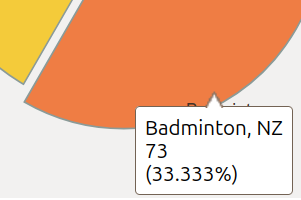
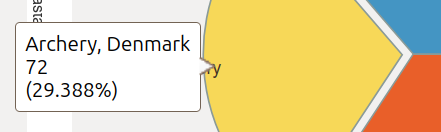
These pointers are defined by small images defined as pointers. The images used should have the same colour as the bordered box. The pointer image below works nicely with a blue tool-tip colour style.

tool_tip_border_color:

tool_tip_1: &tool_tip_up "data:image/gif;base64,R0lGOD...QADs="
tool_tip_2: &tool_tip_down "data:image/gif;base64,R0lGOD...RADs="
tool_tip_3: &tool_tip_left "data:image/gif;base64,R0lGOD...AOw=="
tool_tip_4: &tool_tip_right "data:image/gif;base64,R0lGOD...AOw=="

...

connector_style: 'paleblue'
tool_tip_connector_up: *tool_tip_up
tool_tip_connector_down: *tool_tip_down
tool_tip_connector_left: *tool_tip_left
tool_tip_connector_right: *tool_tip_right
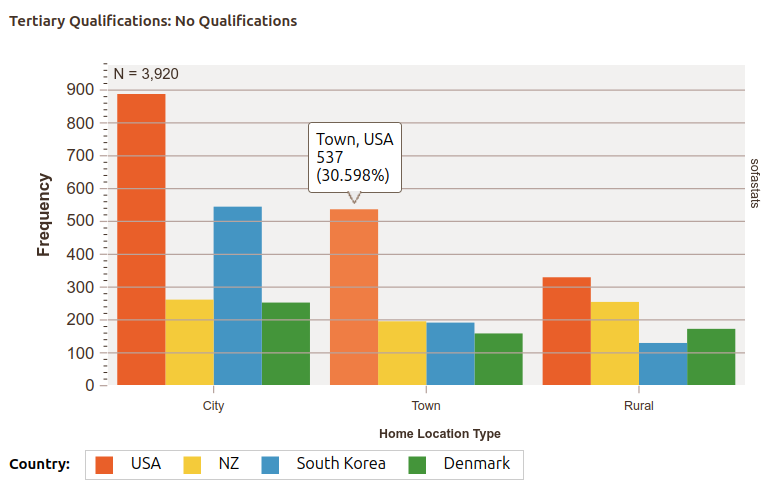
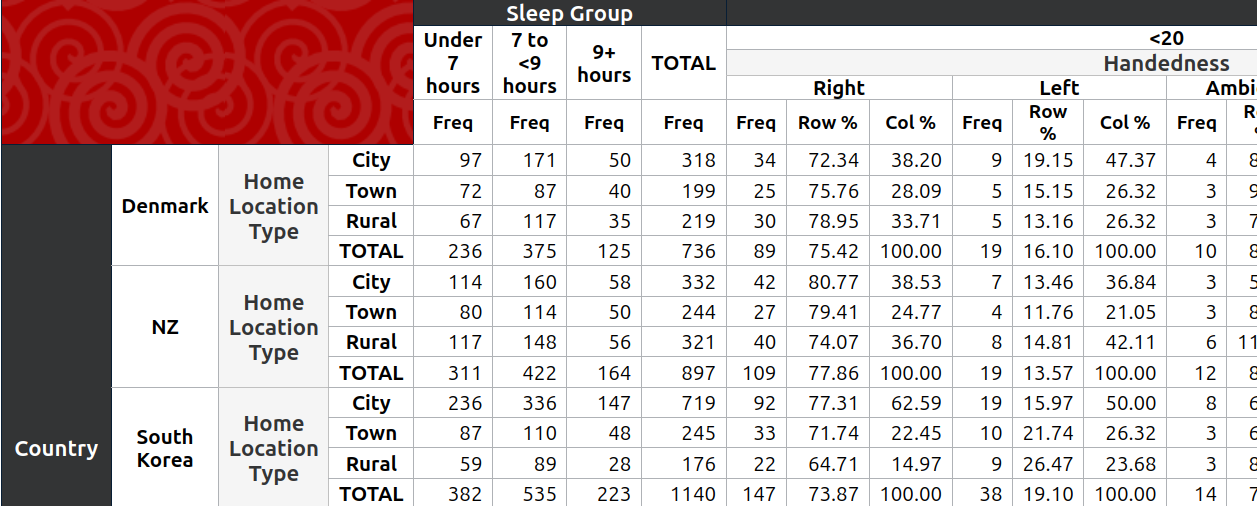
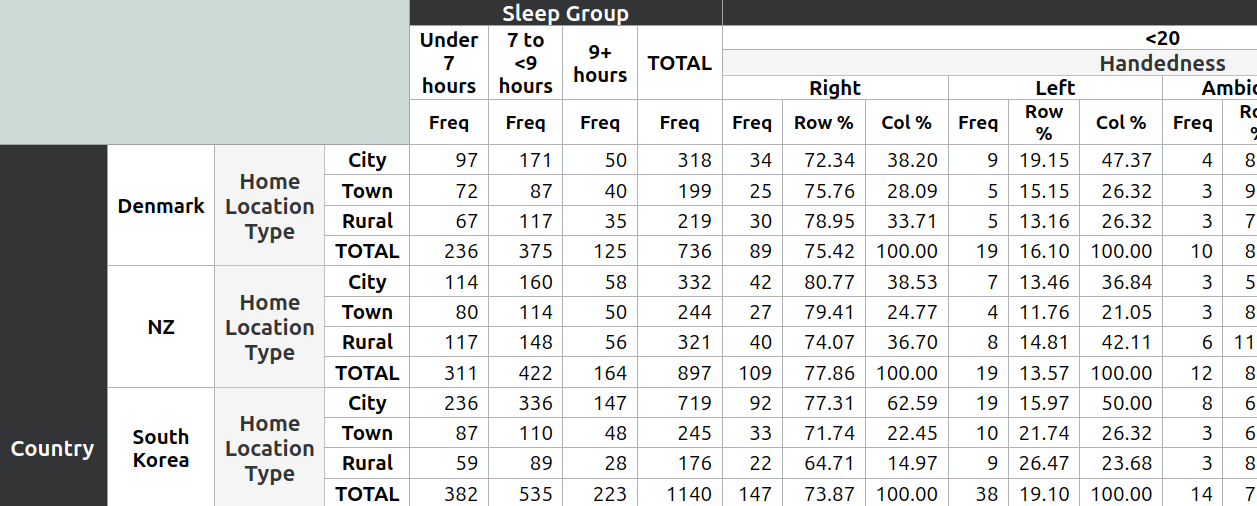
Example Report Table Settings
Don't worry if you don't like the red background colour in the table place-holder, it is easily changed. Which is the point of customisable styles - you can make whatever you want.
Style 1
# Report Tables

top_left_table_space_holder_background_color: ''
top_left_table_space_holder_background_image: "data:image/gif;base64,R0lGODl...A7"  ## image converted to base64 - see below

first_level_variable_font_color: *white
first_level_variable_background_color: *black_blue
first_level_variable_border_color: *charcoal_blue

variable_font_color_other_levels: *black_blue
variable_background_color_other_levels: *light_gray
variable_border_color_other_levels: *mid_gray
Style 2
# Report Tables

top_left_table_space_holder_background_color: '#ccd9d7'
top_left_table_space_holder_background_image: ''

first_level_variable_font_color: *white
first_level_variable_background_color: *black_blue
first_level_variable_border_color: *charcoal_blue

variable_font_color_other_levels: *black_blue
variable_background_color_other_levels: *light_gray
variable_border_color_other_levels: *mid_gray
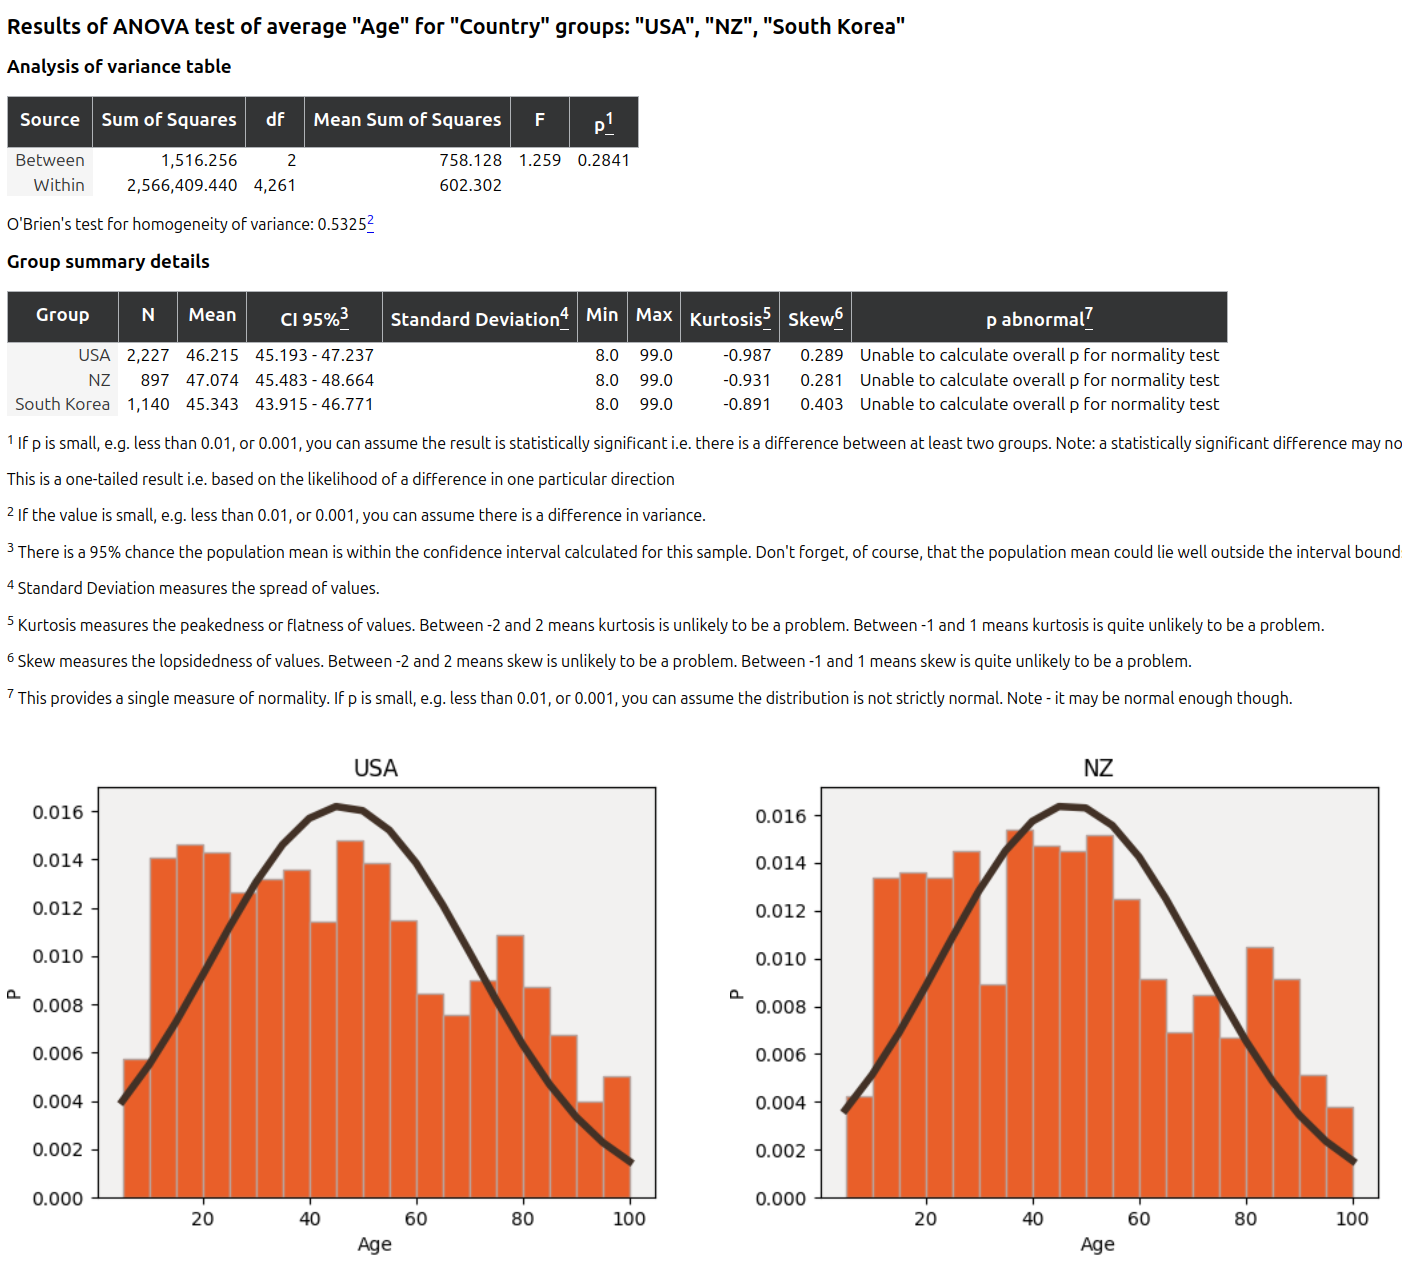
Example Statistics Table Settings
Style 1
Statistical reports use standard report table settings as well as settings specific to statistical tests.
# Report Tables

top_left_table_space_holder_background_color: *gray_blue
top_left_table_space_holder_background_image: *background_image

first_level_variable_font_color: *white
first_level_variable_background_color: *black_blue
first_level_variable_border_color: *darker_mid_gray

variable_font_color_other_levels: *black_blue
variable_background_color_other_levels: *light_gray
variable_border_color_other_levels: *mid_gray

# Statistical Test Tables

heading_footnote_font_color: *white
footnote_font_color: *black
Style 2
# Report Tables

top_left_table_space_holder_background_color: 'black'
top_left_table_space_holder_background_image: *background_image

first_level_variable_font_color: 'white'
first_level_variable_background_color: 'black'
first_level_variable_border_color: *darker_mid_gray

variable_font_color_other_levels: 'black'
variable_background_color_other_levels: *pale_blue
variable_border_color_other_levels: *less_pale_blue

# Statistical Test Tables

heading_footnote_font_color: 'white'
footnote_font_color: 'black'