The Journal of Open Source Software Paper
sofastats_lib: A Python package for basic statistical tests, report tables, and charting
Grant Paton-Simpson
Summary
sofastats_lib is a Python library for statistical analysis and reporting based on the design of the SOFA Statistics desktop application (2009 to present).
sofatstats_lib provides a standard interface for connecting to CSV files and databases and generating report-ready self-contained HTML output. In the case of statistical tests, result are also generated in an object (data class) readily consumed by Python programs. Where it makes sense, there is also the option of worked example explanations of the results using the actual data used - for example, of the Mann-Whitney U results. - All output can be styled by pre-existing styles or by custom YAML-defined styles (https://sofastats.github.io/sofastats_lib/styles/).
Statement of Need
Python is the most popular language for data science and analytics. Python developers are well served with basic statistical tests and visualization options. But there is a gap for an integrated set of tools for charting, report tables, and inferential statistical tests. sofastats_lib aims to make such tools accessible to beginners as well as expert analysts through a standardized API (see https://sofastats.github.io/sofastats_lib/API), detailed documentation (https://sofastats.github.io/sofastats_lib/ and https://sofastats.github.io/sofastats_lib/data_prep/), and a design informed by UX research (see "How UX Can Improve Your Python Project" by Grant and Charlotte Paton-Simpson: https://www.youtube.com/watch?v=5DDZa46g3Yc).
Features
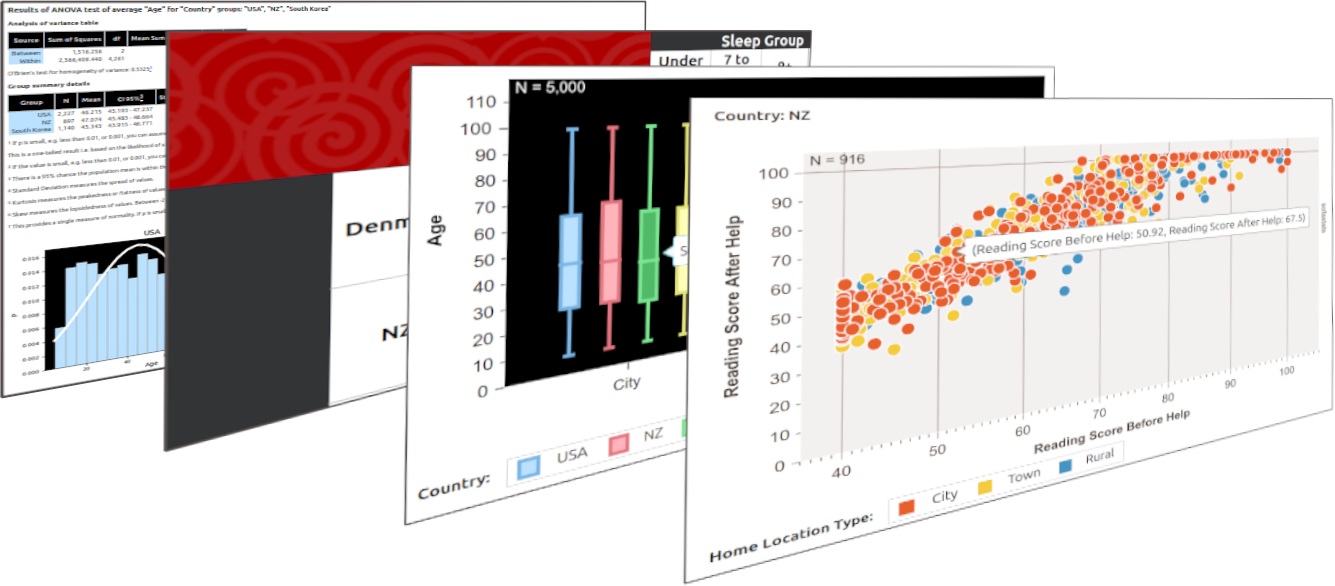
https://sofastats.github.io/sofastats_lib/output_gallery.html
Charts
- Area Charts
- Multiple-Chart Area Charts
- Bar Charts
- Multiple-Chart Bar Charts
- Clustered Bar Charts
- Multiple-Chart Clustered Bar Charts
- Box Plots
- Clustered Box Plots
- Histograms
- Multiple-Chart Histograms
- Line Charts
- Multiple-Chart Line Charts
- Pie Charts
- Multiple-Chart Pie Charts
- Scatter Plots
- Multiple-Chart Scatter Plots
- By Series Scatter Plots
- Multiple-Chart By Series Scatter Plots
Report Tables
- Frequency Tables
- Cross Tabs
Inferential Statistical Tests
- ANOVA (One Way)
- Chi Square (including table of expected and observed values)
- Independent Samples T-Test
- Kruskal-Wallis H
- Mann-Whitney U
- Normality Test (for both independent and paired data)
- Paired Samples T-Test
- Pearson's R Correlation
- Spearman's R Correlation
- Wilcoxon Signed Ranks Test
Examples
Full examples, including all required imports and data sources, can be found at: https://github.com/sofastats/sofastats_lib/tree/main/src/sofastats_examples/scripts
Below are examples of the actual configuration required to make output. The goal of interface design was to minimise boilerplate and standardise across charting, report tables, and statistical tests.
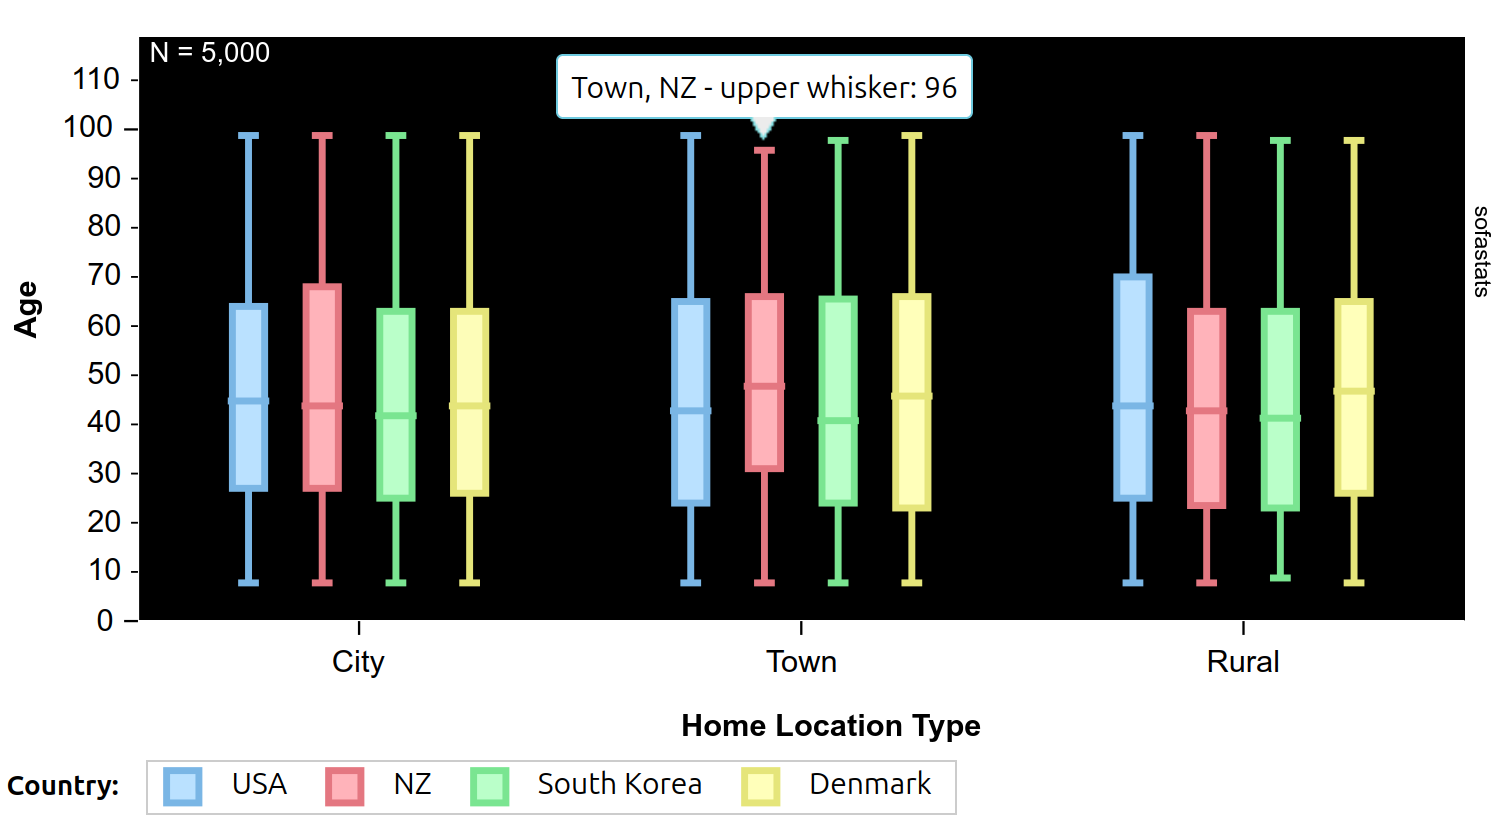
Chart
design = ClusteredBoxplotChartDesign(
    csv_file_path=csv_file_path,
    output_file_path=output_folder / 'demo_multi_series_box_plot_black_pastel.html',
    output_title="Multi-Series Boxplot (black_pastel design)",
    show_in_web_browser=True,
    sort_orders_yaml_file_path=sort_orders_yaml_file_path,
    style_name='black_pastel',
    field_name='Age',
    category_field_name='Home Location Type',
    series_field_name='Country',
    series_sort_order=SortOrder.CUSTOM,
    category_sort_order=SortOrder.CUSTOM,
    box_plot_type=BoxplotType.INSIDE_1_POINT_5_TIMES_IQR,
    show_n_records=True,
    x_axis_font_size=12,
    decimal_points=3,
    )
design.make_output()
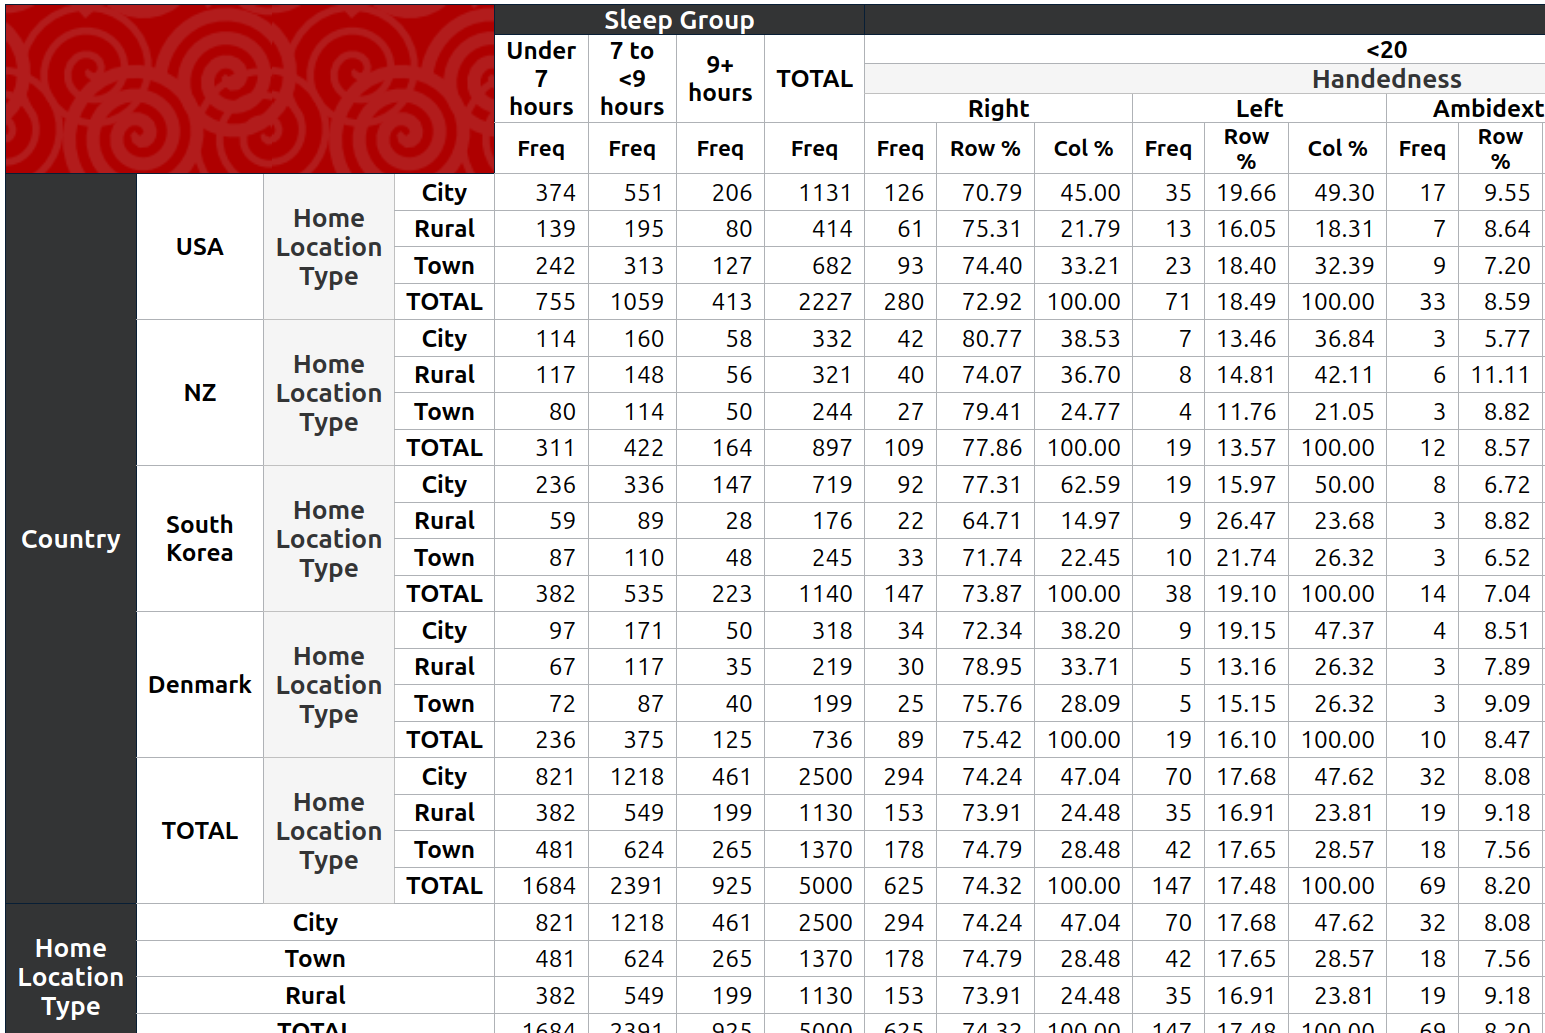
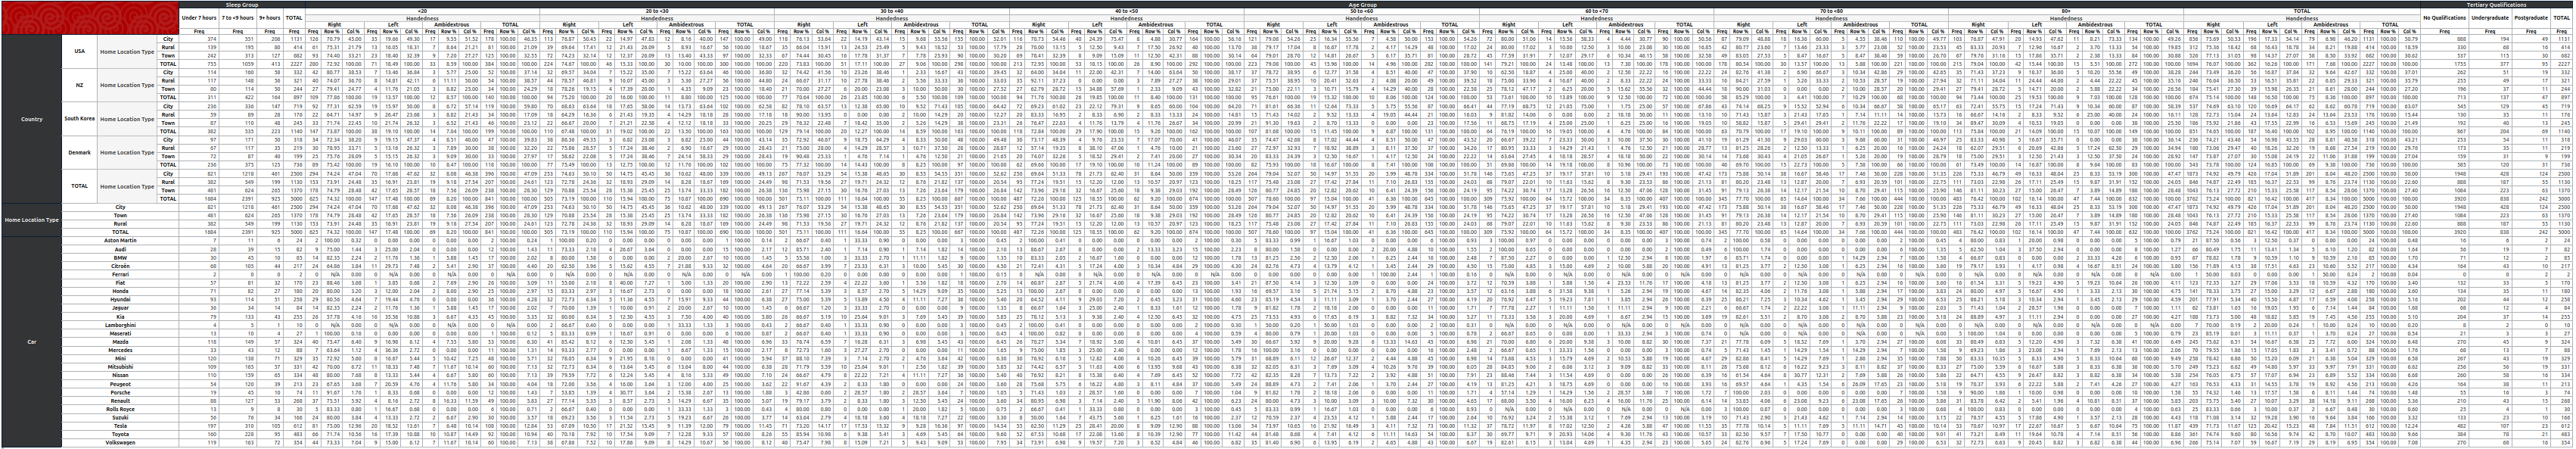
Report Table
row_variables_design_1 = Row(variable_name='Country', has_total=True, sort_order=SortOrder.CUSTOM,
    child=Row(variable_name='Home Location Type', has_total=True, sort_order=SortOrder.VALUE))
row_variables_design_2 = Row(variable_name='Home Location Type', has_total=True, sort_order=SortOrder.CUSTOM)
row_variables_design_3 = Row(variable_name='Car')

col_variables_design_1 = Column(variable_name='Sleep Group', has_total=True, sort_order=SortOrder.CUSTOM)
col_variables_design_2 = Column(variable_name='Age Group', has_total=True, sort_order=SortOrder.CUSTOM,
     child=Column(variable_name='Handedness', has_total=True, sort_order=SortOrder.CUSTOM, pct_metrics=[Metric.ROW_PCT, Metric.COL_PCT]))
col_variables_design_3 = Column(variable_name='Tertiary Qualifications', has_total=True, sort_order=SortOrder.CUSTOM)

design = CrossTabDesign(
    cur=sqlite_cur,
    database_engine_name=DbeName.SQLITE,  ## or just the string 'sqlite'
    source_table_name='people',
    table_filter_sql="WHERE Car IN ('Porsche', 'Audi', 'Toyota', 'Aston Martin')",  ## must have backticks around entity names containing spaces in SQLite; no trailing commas - this is SQL not Python
    output_file_path=output_folder / 'demo_main_cross_tab_from_sqlite_db_filtered.html',
    output_title='Cross Tab from SQLite (Filtered by Car)',
    show_in_web_browser=True,
    sort_orders_yaml_file_path=sort_orders_yaml_file_path,
    row_variable_designs=[row_variables_design_1, row_variables_design_2, row_variables_design_3],
    column_variable_designs=[col_variables_design_1, col_variables_design_2, col_variables_design_3],
    style_name='default',
    decimal_points=2,
)
design.make_output()
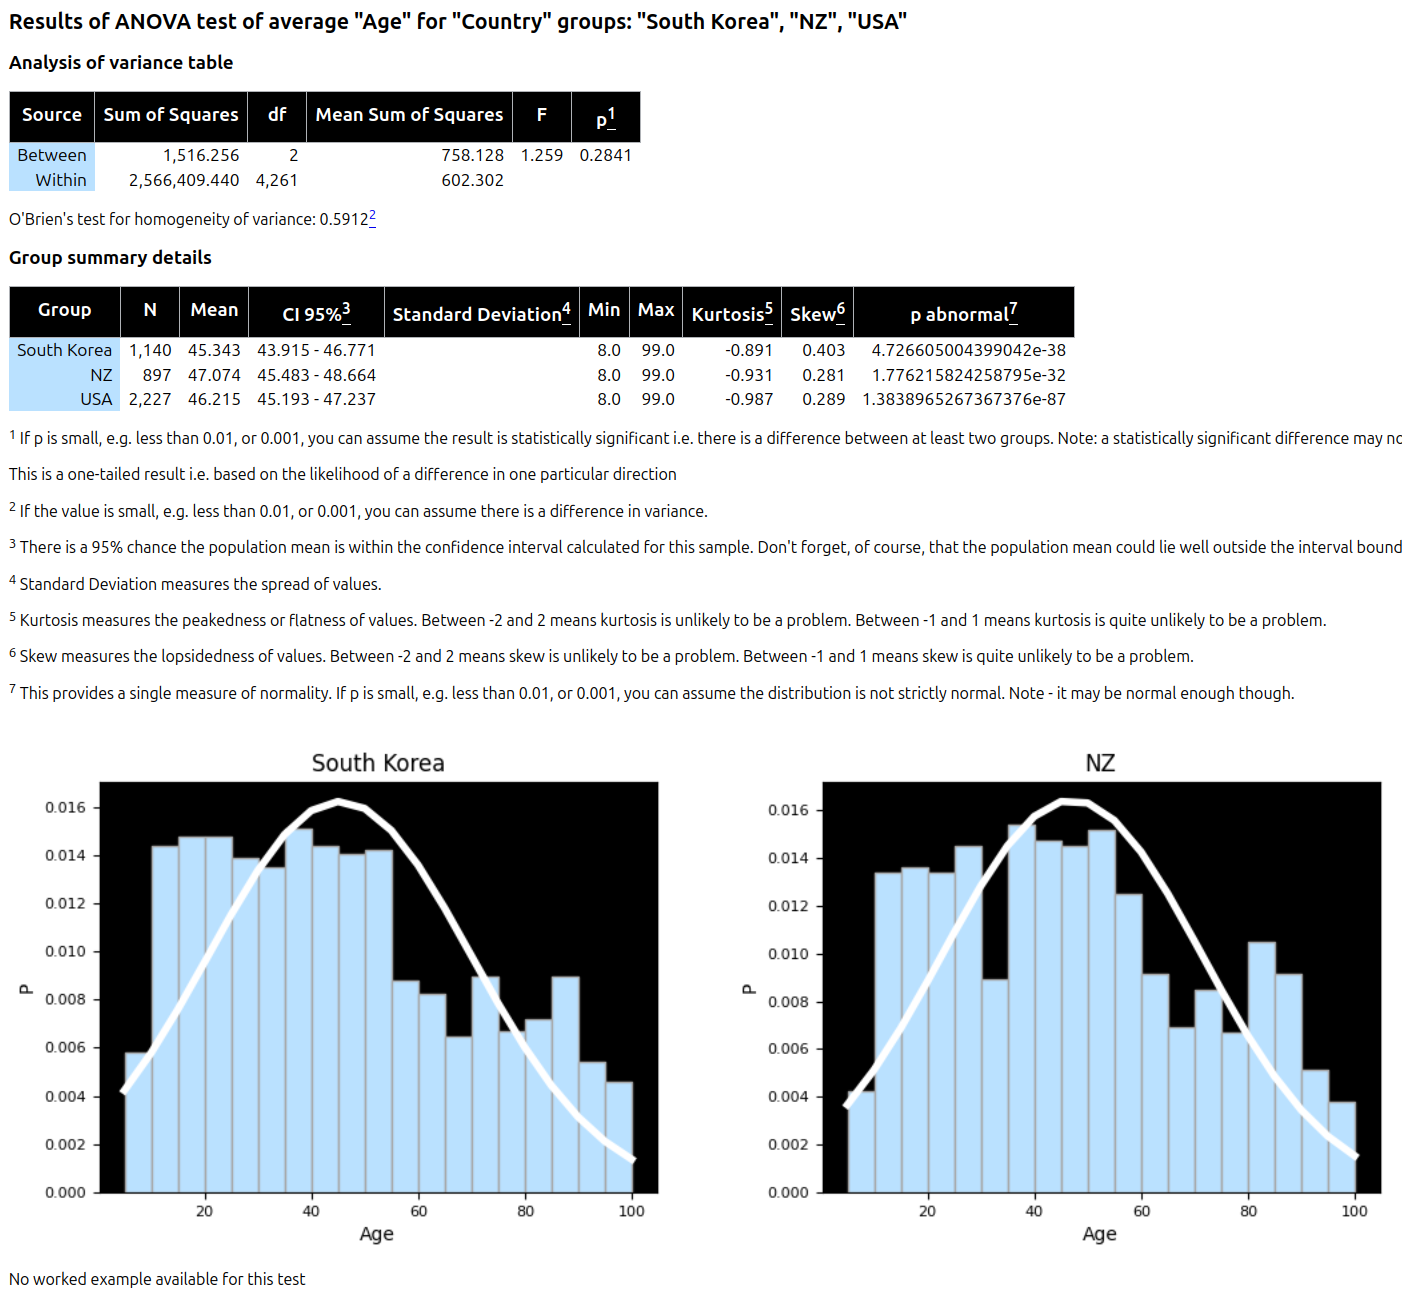
Statistical Test
Close-Up View
Complete View
Note - it may not make sense to make massive tables but the point is that sofastats_lib can generate whatever is configured.
design = AnovaDesign(
    csv_file_path=csv_file_path,
    output_file_path=output_folder / 'demo_anova_age_by_country_black_pastel_style.html',
    output_title='ANOVA - Black Pastel Style',
    show_in_web_browser=True,
    style_name='black_pastel',
    grouping_field_name='Country',
    grouping_field_values=['South Korea', 'NZ', 'USA'],
    measure_field_name='Age',
    high_precision_required=False,
    decimal_points=3,
)
design.make_output()