sofastats_lib
![]()
Package Overview
Statistics Open For All the Python Library.
sofastats_lib is a Python library for statistical analysis and reporting
based on the design of the SOFA Statistics desktop application.
The goal was keep all the tried-and-true elements of the original application but without any of the original design mistakes.
We also wanted to make SOFA more friendly for beginners.
Let us know if you think we succeeded grant@sofastatistics.com.
The sofastats distribution package sits on top of sofastats_lib distribution package and adds a web GUI.
See How UX Can Improve Your Python Project by Grant and Charlotte Paton-Simpson
for how we're trying to improve the User Experience (UX) for SOFA users, and for a peek at the GUI.

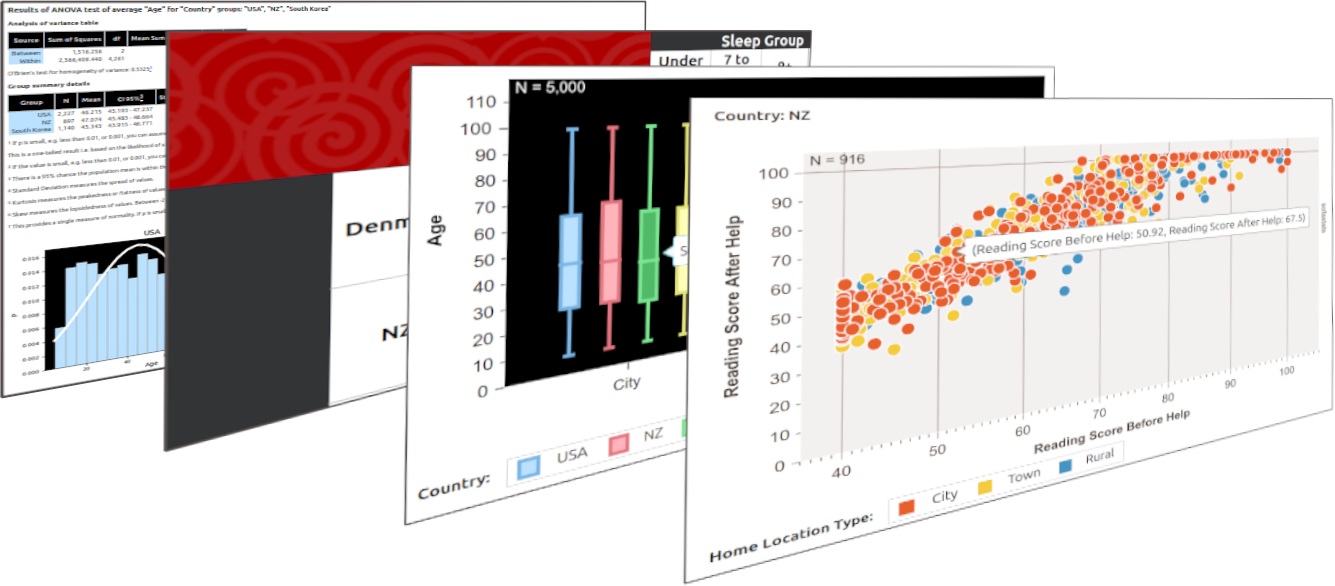
Example Output
sofastats can be used for statistical tests, charting, and report tables.
Check out the Output Gallery
Several styles are built-in, and it is easy to add your own custom styles by copying and editing a simple YAML config file. See Making Custom Styles
Usage Overview
Step 0 - Install sofastats_lib
Step 1 - Configure Design
Configure a Design object e.g. a CrossTabDesign, a SimpleBarChartDesign, or an AnovaDesign.
See API reference for Charts, Tables, and Statistical Tests
for the full list.
Step 2 - Get Output
Use the Design's make_output() method to make the output as an HTML file.
If the Design is for a statistical test (vs a chart or table) you can also use the to_result() method
to generate a results dataclass
which you can extract details from or just print.
Configuration
There are three main settings types:
- Inputs - where is the data source for the design? What sort of data source is it?
- Outputs - where should the output go and what should it look like?
- Analysis Details - which variables are involved and is there any special sorting required - for example, so that '<20' is before '20-39' even though it is the other way round in the default alphabetical order (see Sorting).
Inputs
There are three alternatives so you need to select one and provide the necessary details:
- CSV - data will be ingested into internal sofastats SQLite database
(
source_table_nameoptional - later analyses might be referring to that ingested table so you might as well give it a friendly name) cur,database_engine_name, andsource_table_name- or just a
source_table_name(assumed to be using internal sofastats SQLite database)
Full API here: API reference for Charts, Tables, and Statistical Tests
Outputs
The main setting needed is the specific file location for the HTML output. This is optional, but you may want to control where the file goes.
Full API here: API reference for Charts, Tables, and Statistical Tests
Analysis Details
For example, the SimpleBarChartDesign requires variable_name at the minimum.
Step 3 - Think about the Output Results

This is the hardest step, and we've tried really hard to provide useful information in the output
to make this as easy as possible. If you can think of better ways of providing output or explaining results
let us know at grant@sofastatistics.com.
Examples
Example Simple Bar Chart
from sofastats.conf.main import SortOrder
from sofastats.output.charts.bar import SimpleBarChartDesign

chart_design = SimpleBarChartDesign(
    csv_file_path='/path/to/csv',
    output_file_path= '/path/to/output/demo_simple_bar_chart_from_csv.html',
    output_title="Simple Bar Chart (Frequencies)",
    show_in_web_browser=True,
    sort_orders_yaml_file_path='/path/to/sort_orders_yaml_file_path',
    style_name='default',
    category_field_name='Age Group',
    category_sort_order=SortOrder.CUSTOM,
    rotate_x_labels=False,
    show_borders=False,
    show_n_records=True,
    x_axis_font_size=12,
)
chart_design.make_output()
Example ANOVA
from sofastats.conf.main import SortOrder
from sofastats.output.stats.anova import AnovaDesign

stats_design = AnovaDesign(
    csv_file_path='/path/to/csv',
    output_file_path='/path/to/output/demo_anova_age_by_country.html',
    output_title='ANOVA',
    show_in_web_browser=True,
    sort_orders_yaml_file_path='/path/to/sort_orders_yaml_file_path',
    style_name='prestige_screen',
    grouping_field_name='Country',
    group_values=['South Korea', 'NZ', 'USA'],
    measure_field_name='Age',
    high_precision_required=False,
    decimal_points=3,
)
stats_design.make_output()
print(stats_design.to_result())
More Examples
See sofastats_lib/examples
sofastats_examples Library
Install the sofastats_examples library and run the demo scripts - fake data and a sort order YAML file are included so you can see the code in operation for every chart, table, and statistical report Design type.
Full API
API reference for Charts, Tables, and Statistical Tests
Installation
Step 0 - Install a modern Python package manager
The best choice for a modern Python package manager if you don't have an existing preference is uv.
Start by installing uv as per: Installing uv
Step 1 - Create a new project
Create a project. If you’re using uv, the commands would be:
cd /my/projects/folder
For example:
cd ~/projects
uv:
uv init my_project_name
For example:

We can check what uv has made by looking at contents of the new project folder, in this case using the tree command:
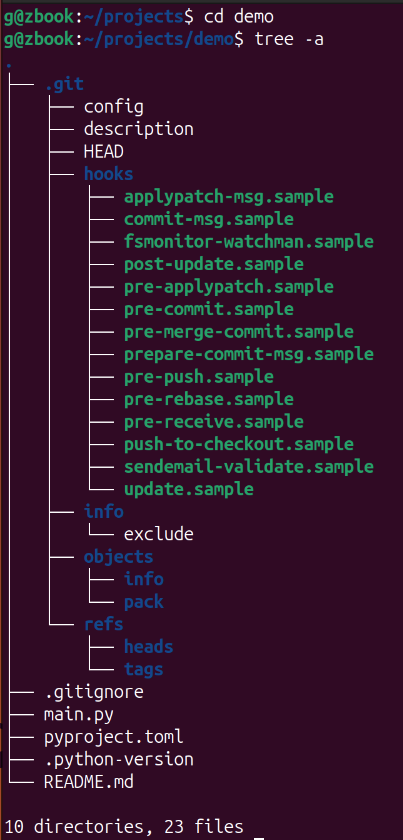
As you can see, a lot of boilerplate has been set up.
Don’t worry if you can’t use the tree command on your machine – we just wanted to show you what has been made by uv.

Step 2 - Install sofastats_lib as a project library
Inside the demo folder, add sofastats_lib to the demo project. Here’s how you do it with uv:
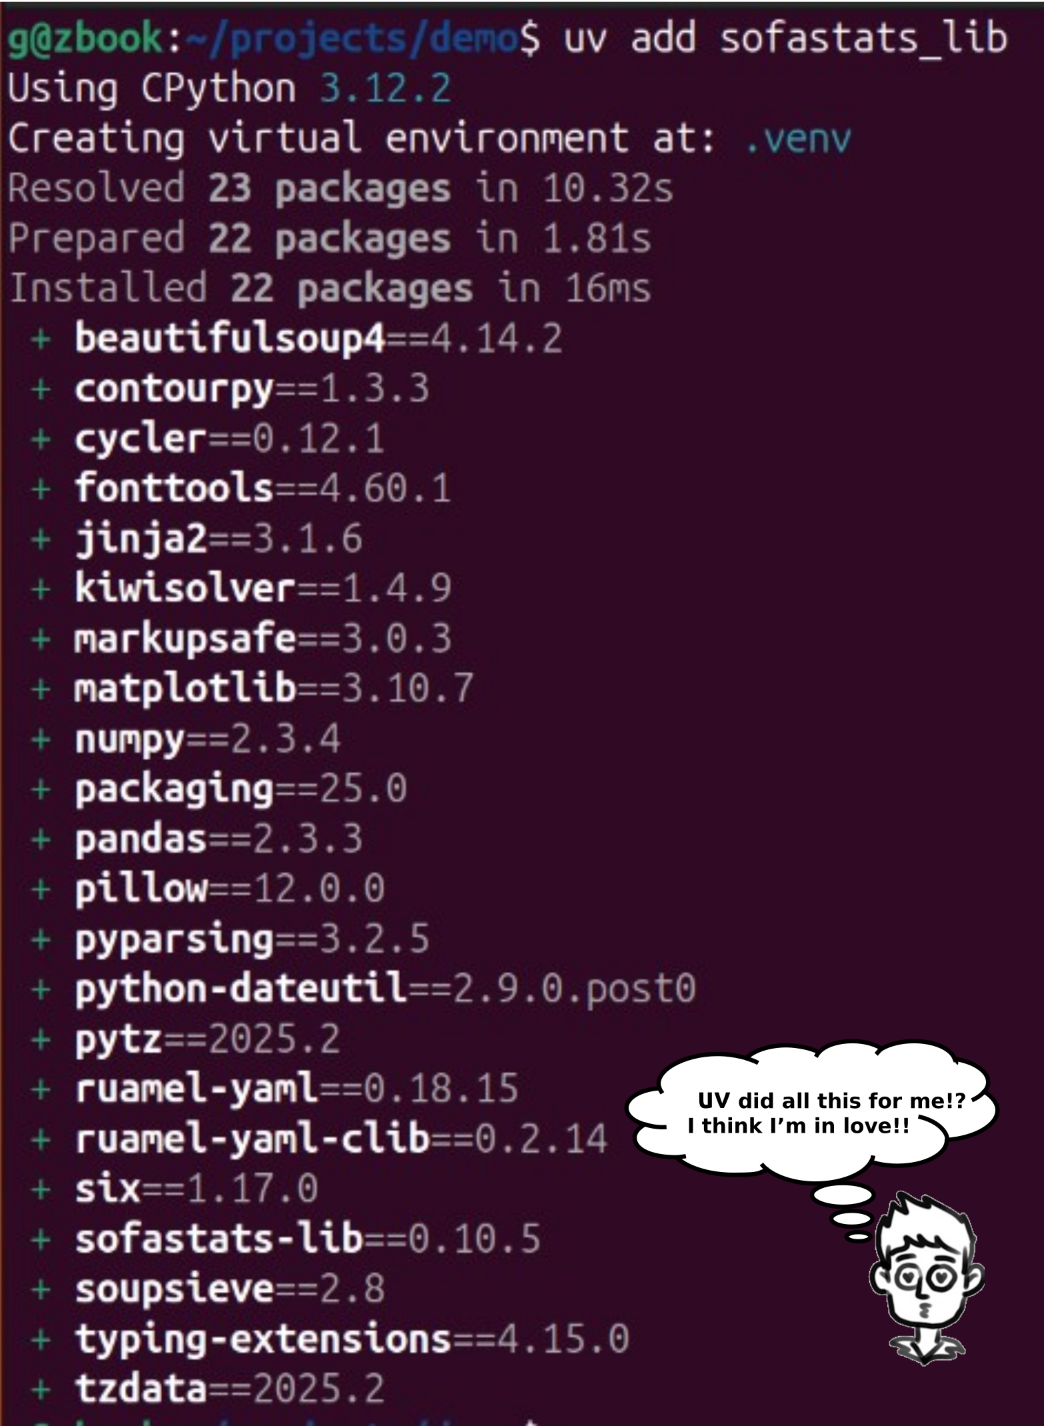
Now sofastats_lib is installed as a library ready to use somewhere under demo like
demo/.venv/lib/python3.13/site-packages/sofastats_lib/
Source Code
sofastats_lib is 100% open source. We welcome bug fixes, issues, and pull requests.